Archive for December, 2010

Red Deer Market Update – Dec. 24/10

Wednesday, December 29th, 2010
Market Update to Dec. 23/10 Red Deer
Price Range All

Active

Pending Active 1 Year Ago Sold MTD

Dec. 16/10

Sold MTD

Dec. 23/10

Sold MTD

Dec. 23/09

< 100 20 0 19 5 5 4
100 – 150 35 2 27 4 7 2
150 – 200 56 0 40 8 11 5
200 – 250 65 2 65 13 14 11
250 – 300 94 5 99 15 25 13
300 – 325 46 2 39 6 10 10
325 – 350 35 3 45 3 5 6
350 – 375 23 2 22 4 4 6
375 – 400 37 1 29 2 2 6
400 – 450 34 0 32 3 6 4
450 – 500 25 0 20 1 2 1
500+ 48 1 47 1 1 3
Total 518 18 484 65 92 71
Avg. Price $320,919. $324,524. $268,276. $270,130. $294,389.
Days On Market 71 57 57 60 50

Market Update – We’ve said many times it takes population growth to maintain a stable housing market.  While we don’t have the old days back yet, we are moving in the right direction.  We expect activity to increase relative to population growth in the new year.  We don’t expect prices to escalate much without significant population growth. 

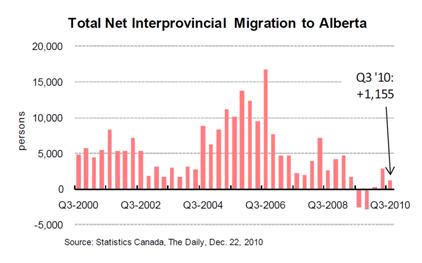
Interprovincial Net Migration Slows – Todd Hirsch – Senior Economist, ATB Financial – December 22, 2010 

A growing population is critical to the health of several economic sectors, including retail trade, housing markets, labour markets, and the tax base. Alberta’s population is still growing quite nicely, but the mix of factors contributing to the growth is shifting. 

Alberta’s total population rose by 14,100 (+0.4%) to an estimated 3,735,100. That increase matched the national growth rate; BC had the fastest growing population (+0.5%). Canada’s total population is now 34,238,035. 

During the third quarter of 2010, an estimated 21,702 people moved to Alberta from other provinces. At the same time, some 20,547 people from Alberta packed up and left for other provinces. On a net basis, Alberta’s interprovincial migration remained positive at 1,155 people—less than half the number in the second quarter. Interprovincial migration has returned to positive territory in 2010, but only barely. Stronger job markets in other provinces (notably Saskatchewan) have curtailed the inflow of job seekers. 

While interprovincial migration has not been as significant a source of population growth as it had been, other factors have propelled Alberta’s population higher. 

Natural population growth (i.e., births minus deaths) added 8,267 people. Alberta has the highest natural growth rate in the country, reflecting the high percentage of young families of child-rearing age. Net international migration also added 6,014 people.


Red Deer Market Update – Dec. 17/10

Friday, December 17th, 2010
Market Update to Dec. 16/10 Red Deer
Price Range All

Active

Pending Active 1 Year Ago Sold MTD

Dec. 9/10

Sold MTD

Dec. 16/10

Sold MTD

Dec. 16/09

< 100 20 0 19 4 4 3
100 – 150 34 1 27 1 1 2
150 – 200 58 1 40 5 6 4
200 – 250 63 1 65 7 8 8
250 – 300 109 11 99 9 10 5
300 – 325 46 3 39 5 6 9
325 – 350 39 2 45 0 0 4
350 – 375 25 0 22 3 3 6
375 – 400 36 0 29 1 1 6
400 – 450 36 2 32 0 0 3
450 – 500 27 2 20 1 1 1
500+ 52 1 47 1 1 2
Total 545 24 484 37 41 53
Avg. Price $323,755. $324,524. $273,516. $271,551. $299,373.
Days On Market 69 57 58 60 51

Capacity Utilization Rising in Energy Sector – Todd Hirsch, Senior Economist, ATB Financial 

December 13, 2010 – High oil prices have been a lifeline for Alberta’s provincial economy in 2010. Those higher prices are showing up in how the industry is putting its resources to work. 

The percentage of industrial capacity being used in Canada’s oil and gas drilling sector rose to 80.9% in the third quarter of 2010, up from 80.3% in the second quarter. The increase brings national utilization to its highest point since the spring of 2007—long before the crash in energy prices sent Alberta’s energy dependent economy spiralling into recession. 

Total capacity utilization for all sectors in the country rose to 78.1% in the third quarter, up from 76.9% in the second quarter. It was the fifth consecutive increase since the record low rate of 67.8% in the second quarter of 2009. 

Capacity utilization is a useful indicator that estimates how much machinery, equipment, and other production resources are being activity put to use. The higher the utilization rate, the smaller is the excess capacity. As utilization rates approach 100%, inflationary pressures start to build. 

Utilization rates are not calculated at the provincial level, but the oil and gas sector in Canada is dominated by activity in Alberta. 

At 80.9% capacity utilization, the energy sector is clearly in better shape than it was a year or two ago. Higher oil prices have been the main driver, and utilization rates are building. However, weak natural gas prices are still leaving plenty of spare capacity on that side of the industry.

Red Deer Market Update – Dec. 10/10

Friday, December 10th, 2010
Market Update to Dec. 9/10 Red Deer
Price Range All

Active

Pending Active 1 Year Ago Sold MTD

Nov. 30/10

Sold MTD

Dec. 9/10

Sold MTD

Dec. 9/09

< 100 24 1 20 4 4 2
100 – 150 37 3 26 2 1 1
150 – 200 58 2 39 6 5 2
200 – 250 73 7 66 22 7 5
250 – 300 114 5 94 28 9 3
300 – 325 44 3 38 15 5 4
325 – 350 41 2 42 7 0 3
350 – 375 28 1 24 6 3 3
375 – 400 36 1 29 3 1 5
400 – 450 40 4 35 8 0 1
450 – 500 31 1 19 4 1 1
500+ 53 1 52 8 1 1
Total 579 31 484 113 37 31
Avg. Price $321,356. $329,239. $309,608. $273,516. $296,084.
Days On Market 65 56 58 58 53

The Average House Price is Up?

The Red Deer Advocate, CMHC, The Bank of Montreal and the Realtor’s Association of Central Alberta have all recently reported that average sale prices are up this year.  Many folks who have been trying to sell their homes may be scratching their heads wondering why “reputable” sources would say something like that when their real estate associates are telling them that prices are down.  It’s a shame some of the experts don’t explain their statistics a little better.

There is a simple explanation.  In April of 2010, the rules for mortgage qualifying got a lot tougher.  The Federal Government instructed CMHC (and therefore the banks) to make it harder to qualify for a mortgage to prevent Canadians from getting into a mess like the Americans are trying to clean up now.

Those rule changes most affected first time buyers and sales of “starter homes” (sale prices less than $300,000) dropped 25% in the first 11 months of 2010 compared to the first 11 months of 2009.  In the same period sales of move up and high end homes also dropped, but only by 14%.

Surprise!  Sales of homes over $500,000 during that same time frame increased by more than 30%!

So, if more high priced homes sold compared to low priced homes in 2010 compared to 2009, it only makes sense that the ”average” price is higher.

You really can make statistics say anything you want.

The real truth about house prices can only be found through direct comparison of similar homes sold during the different time frames.  That process is not an exact science either, but it is likely more accurate than using mere averages.

An analysis of sales of starter and move up homes in Red Deer suggests that house prices in Red Deer are down between $10,000 and $20,000 (depending on the price range) from last spring before the government changed the rules and this fall.

The rule changes probably had a large influence on prices since activity in the housing market starts at the bottom of the price range and works its way up.  When lower priced homes sell for less, those people have to move up to a lower price, especially when it’s harder to qualify for a mortgage.

Obviously the economy is another factor affecting house prices.  While we are seeing signs that things are looking up, it may be a while before there is enough improvement to affect house prices.  It took 8 months for prices to come down 3 to 4 percent and it will almost certainly take that long for them to recover that much.

This is the new normal.  Make your home buying and selling decisions based on your family’s needs, not on your expectations for price inflation.  It’s always a good time to buy or sell if it’s in your family’s best interests.

Red Deer Weekly Market Update – Dec. 3/10

Friday, December 3rd, 2010
Market Update to Dec. 2/10 Red Deer
Price Range All

Active

Pending Active 1 Year Ago Sold MTD

Nov. 25/10

Sold MTD

Nov. 30/10

Sold MTD

Nov. 30/09

< 100 25 1 21 4 4 4
100 – 150 37 1 28 2 2 1
150 – 200 54 1 43 6 6 11
200 – 250 79 9 72 17 22 21
250 – 300 117 6 104 21 28 20
300 – 325 49 4 41 14 15 19
325 – 350 41 0 44 7 7 13
350 – 375 28 1 28 6 6 9
375 – 400 39 2 36 3 3 5
400 – 450 39 1 38 8 8 4
450 – 500 33 1 22 4 4 2
500+ 54 2 61 8 8 5
Total 595 29 538 100 113 114
Avg. Price $322,950. $334,856. $312,922. $309,608. $291,957.
Days On Market 64 53 57 58 47

The New Normal – Let’s face it.  We could sit around and lament about the good old days – when house prices were going up $10,000 per month – but were they really the good old days?  When you had to compete with 3 or 4 or more other buyers and offer more than full price for a house you didn’t even like that much.  The sooner we stop pining for the good old days and understand that this is the new normal, the better off we will be.  Now is the right time to make a move.

Alberta — Among the most affordable in Canada – RBC Economics Housing Affordability Survey

Despite substantially improved housing affordability in the province since early 2008, housing demand in Alberta is still a shadow of its former self from just a few years ago, and there are few signs that it is picking up meaningfully.

Market conditions remained quite weak in the third quarter, and buyers have emerged clearly in the driver’s seat, causing home prices to decline (down between 0.6% and 2.2% depending on the housing type) and contributing to further improvement affordability. The RBC Measures eased between 0.8 and 1.8 percentage points, more than reversing modest rises in the second quarter. Homeownership in Alberta is among the more affordable in Canada both in absolute terms and relative to its historical averages.

Such a high degree of affordability augurs well for a strengthening in housing demand, once the provincial job market sustains more substantial gains.

Alberta Job Market Lagging… for Now – Todd Hirsch, Senior Economist, ATB Financial

Alberta is used to being #1 when it comes to the economy. Over the years leading up to the 2009 recession, the province was racking up a series of top honours.  But coming out of the recession, Alberta still holds one not-so-flattering #1 position: the most lagging job market.

While some jobs have started to return to Alberta in 2010, employment growth has been slower than in the rest of the country. For Canada overall, total employment has now exceeded its pre-recession peak. Even Ontario has done better in the jobs category coming out of the recession.

During the recession, Alberta’s unemployment rate more than doubled, peaking at 7.5% in March of 2010 (seasonally adjusted). From the peak of employment in fall 2008 to the bottom in March 2010, over 75,000 jobs vanished in Alberta—on a proportional basis, it was the worst hit of all ten provinces.

As always, some perspective is necessary. Even though Alberta’s unemployment rate rose proportionately more than any other province, it started from an extremely low base.

Now, with an unemployment rate of 6% in October, Alberta still has a lower rate than most other provinces—and nearly 2 percentage points below the national average. Not bad, really, for the hardest-hit job market in the country!

However, with Alberta’s economy on the mend, it might not be too long before Alberta sees a return to labour shortages.