Red Deer Market Update – Mar. 11/11
Friday, March 11th, 2011More Jobs = Population Increase = Stronger Demand for Housing
Those who are still waiting for prices to come down before buying might want to start looking now. More jobs will equate to more demand and eventually higher prices. Our current environment of low prices and low interest rates creates the perfect time to buy and it won’t last forever. Let the Hiring Begin!
Todd Hirsch – Senior Economist, ATB Financial
Job creation in Alberta lagged behind most other provinces in the 2010 recovery period, but stronger employment growth started to pick up around the turn of the year. What are Alberta employers anticipating this spring? According to the latest survey of employers from Manpower Canada, companies in Calgary, Edmonton and Red Deer are expected (on balance) to add to their payrolls in the second quarter of 2011. The survey calculates the difference between the percentage of firms expecting to expand payrolls and the percentage of firms expecting to contract them. The difference for all three Alberta cities in the survey is positive. Reversing a trend seen in previous Manpower reports, firms in Calgary are now expected to lead the province in terms of increasing employment. The balance of net employment outlook in Calgary stands at 26%, which is an improvement over earlier surveys. Employers in Edmonton and Red Deer, which had traditionally led the gains, now trail with a net positive balance of 12% and 10%, respectively. The Manpower survey press release notes that nationally, Canadian employers are expected to add to their payrolls (i.e., a net positive outlook), but that optimism is particularly strong in Western Canada. Activity in the energy and mining sectors are identified as the primary drivers.
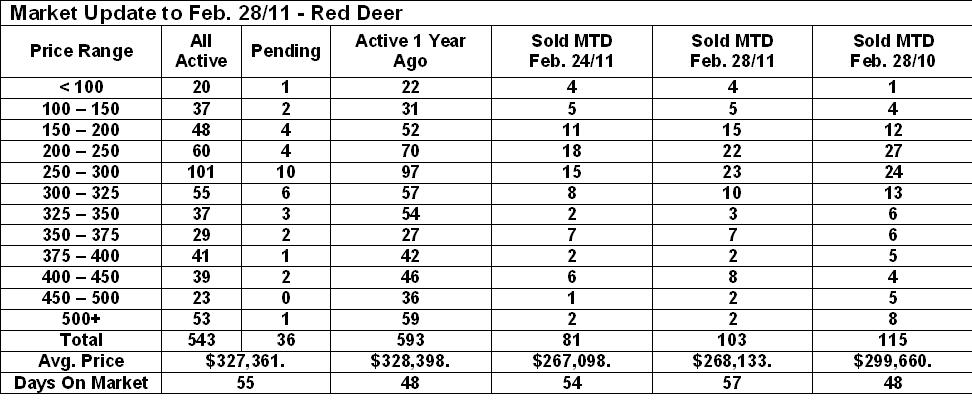
| Market Update to Mar.10/11 – Red Deer | ||||||
| Price Range | All
Active |
Pending | Active 1 Year Ago | Sold MTD
Feb. 28/11 |
Sold MTD
Mar. 10/11 |
Sold MTD
Mar. 11/10 |
| < 100 | 21 | 2 | 19 | 4 | 2 | 1 |
| 100 – 150 | 37 | 1 | 34 | 5 | 1 | 1 |
| 150 – 200 | 46 | 2 | 55 | 15 | 3 | 4 |
| 200 – 250 | 54 | 8 | 72 | 22 | 10 | 4 |
| 250 – 300 | 89 | 9 | 102 | 23 | 13 | 10 |
| 300 – 325 | 52 | 3 | 68 | 10 | 8 | 5 |
| 325 – 350 | 33 | 4 | 59 | 3 | 2 | 3 |
| 350 – 375 | 29 | 4 | 31 | 7 | 2 | 1 |
| 375 – 400 | 37 | 2 | 44 | 2 | 1 | 2 |
| 400 – 450 | 42 | 2 | 50 | 8 | 2 | 2 |
| 450 – 500 | 24 | 0 | 34 | 2 | 1 | 4 |
| 500+ | 55 | 3 | 59 | 2 | 0 | 2 |
| Total | 519 | 40 | 627 | 103 | 45 | 39 |
| Avg. Price | $328,982 | $329,779 | $268,133 | $270,518 | $312,225 | |
| Days On Market | 54 | 49 | 57 | 58 | 40 | |


