August 12, 2011 – Weekly Market Update
The central Alberta real estate market is chugging along about how we expected. Until now sales have been up or at least equal to last year’s in most central Alberta markets. It’s hard to predict how the most recent economic turmoil will affect the market, but there is always a silver lining – interest rates should remain low, keeping housing affordable.
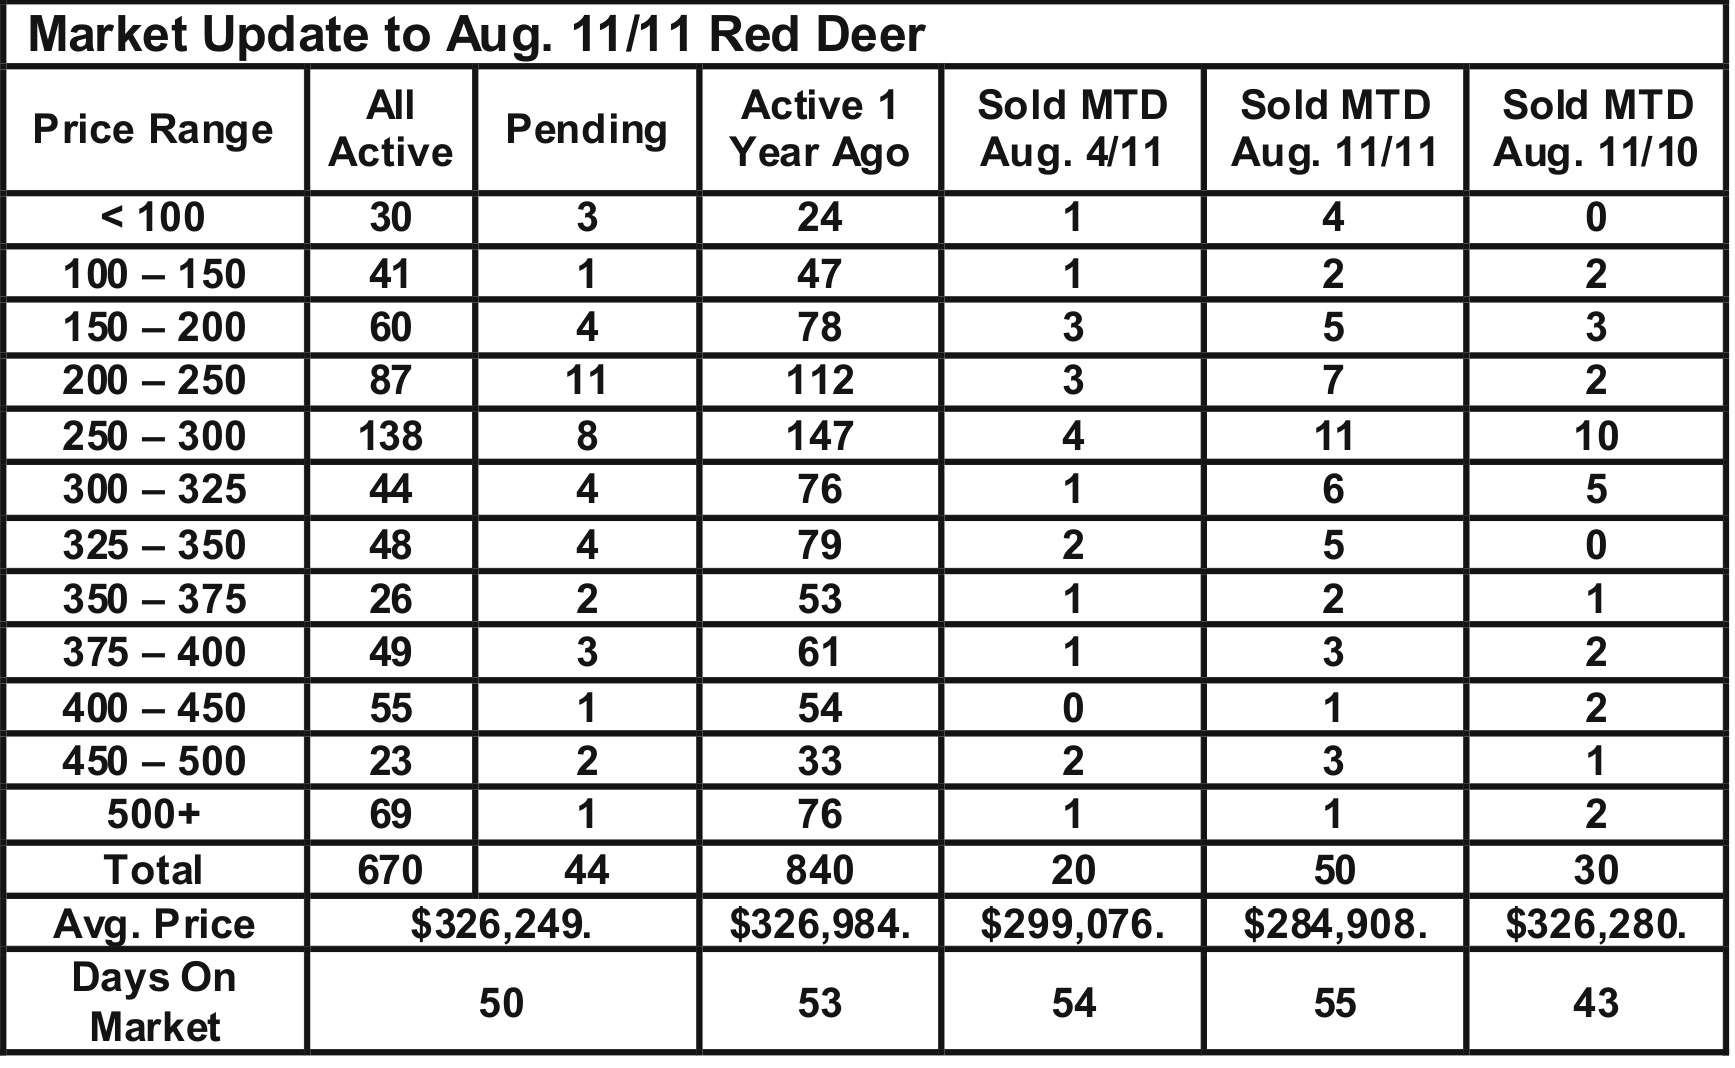
Generally, the market is most in balance in Red Deer with the outlying areas still favouring buyers with ample supply and mediocre demand. People moving to the area generally start in Red Deer where most of the jobs are. There is still ample inventory in Red Deer and higher gas prices may be keeping people close to their jobs.
The majority of sales activity still happens in the lower price ranges. The upper end market continues to heavily favour buyers with ample supply and low demand which creates opportunity for those families looking to move up.
We believe the slight improvement in the market generally can be attributed to a more active oil industry that has caused population growth – increased demand. New housing starts this year are lower which has helped keep the supply side of the market from getting too large – stable supply.
Very simply, the relationship between supply and demand dictates price movement and the health of the housing market. CMHC defines a balanced market, where neither buyers or sellers have an advantage, as one where 25 – 30% of the inventory sells each month.
Red Deer – year to date sales are up 9.24% over the same period in 2010 – demand is up. The number of active listings as of the first of August were down 20% this year compared to last – supply is down. As a result, our sales to listing ratio in July was 22%, not quite high enough to support price increases, but much closer than we were a year ago – the market balance slightly favours buyers.
Lacombe – year to date sales are down slightly compared to last year – demand is down. The number of active listings on August 1st were the same as they were last August – supply is equal. The sales to listings ratio in July of this year was 17% – the market favours buyers.
Ponoka – year to date sales are up 24% over the same period in 2010 – demand is up. Active listings are 9% higher than Aug. 1, 2010 – supply is up. The sales to listings ratio in July was 11.5% – the market favours buyers.
Sylvan Lake – year to date sales are the same as 2010 – demand is equal. Active listings on Aug. 1 were up 8% compared to Aug. 1, 2010 – supply is up. The sales to listings ratio in July was 11% – the market favours buyers.
Blackfalds – year to date sales are up 25% compared to the same period in 2010 – demand is up. Active listings on Aug. 1 were equal compared to Aug. 1, 2010 – supply is equal. The sales to listings ratio in July was 13.6% – the market favours buyers.
The acreage market closely resembles the rest of the market with a sales to listing ratio of about 10%. Sales at the high end of the price range are rare with most of the activity at the low end of the price spectrum.