January 13, 2012 – 2011 YEAR END MARKET UPDATE
Friday, January 13th, 20122011 Year End Market Update – 2011 was a much better year than 2010 with MLS sales in central Alberta up 19.5%. We are still a long ways from the 2007 boom at only at 73% of that year’s heady levels, but 2011 did get back to 2009 sales levels.
At the same time our inventory of active listings has steadily dropped in most markets but especially in Red Deer, trending closer to balanced market conditions than we’ve seen in three years. We are not back to that perfect balance yet, but if the current trend continues we could see those conditions later this spring.
Everyone wants to know what prices are going to do. Future predictions are very dangerous, but a simple law of economics states that when demand increases and supply decreases, prices will go up. We have seen the relationship between supply and demand diminish over the last six months and know that a continuation of that trend will eventually see prices firm up.
Our analysis of the median price of homes sold in Red Deer, Lacombe, Sylvan Lake, Ponoka, Innisfail, Blackfalds and Penhold over the past year shows that prices went down in the spring and summer and increased slightly the last six months. The median price of homes in those markets is still down approximately 9% from the high in the second quarter of 2007. While the median is not always and accurate representation of value, it does show us trends. We believe the trend right now is up barring an economic collapse in Europe or the United States. High oil prices continue to be the key factor in our economic well being.
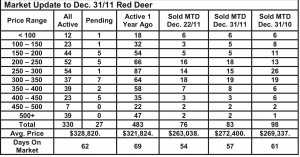
Red Deer – 2011 sales were up almost 13% over 2010. Active listings as of Dec 31 this year are down an incredible 42% over Dec. 31, 2010. The December sales to active listing ratio was 20.2% down from the previous month but probably just a reflection of a typically slower Christmas season.
Lacombe – 2011 sales were up 8.4% over 2012. Listings were slightly higher at the end of 2011 and the ratio of sales to active listings is currently 14% representing a market where the buyer still has an advantage.
Sylvan Lake – 2011 sales managed to eke out a 1.9% increase over 2010. Active listings as of Dec. 31, 2011 are finally trending down by 17% over 2010. The sales to active listing ratio at only 5.6% suggests the Sylvan Lake market still heavily favours buyers.
Ponoka – 2011 sales were up 34% over 2010. Active listings are about the same level as they were a year ago. The sales to active listings ratio was down in December due to the Christmas slowdown, but still suggests a buyer’s market. We expect to see a more balanced market in the spring.
Blackfalds – 2011 sales are up 27% over 2011. Active listings at Dec. 31, 2011 are down 22% from Dec. 2010. The December sales to active listings ratio was 13.5% – still a buyer’s market, but the Blackfalds market is following Red Deer’s lead and quickly trending towards balance.


