Posts Tagged ‘Red Deer real estate market update’

Red Deer Market Update – Dec. 17/10

Friday, December 17th, 2010
Market Update to Dec. 16/10 Red Deer
Price Range All

Active

Pending Active 1 Year Ago Sold MTD

Dec. 9/10

Sold MTD

Dec. 16/10

Sold MTD

Dec. 16/09

< 100 20 0 19 4 4 3
100 – 150 34 1 27 1 1 2
150 – 200 58 1 40 5 6 4
200 – 250 63 1 65 7 8 8
250 – 300 109 11 99 9 10 5
300 – 325 46 3 39 5 6 9
325 – 350 39 2 45 0 0 4
350 – 375 25 0 22 3 3 6
375 – 400 36 0 29 1 1 6
400 – 450 36 2 32 0 0 3
450 – 500 27 2 20 1 1 1
500+ 52 1 47 1 1 2
Total 545 24 484 37 41 53
Avg. Price $323,755. $324,524. $273,516. $271,551. $299,373.
Days On Market 69 57 58 60 51

Capacity Utilization Rising in Energy Sector – Todd Hirsch, Senior Economist, ATB Financial 

December 13, 2010 – High oil prices have been a lifeline for Alberta’s provincial economy in 2010. Those higher prices are showing up in how the industry is putting its resources to work. 

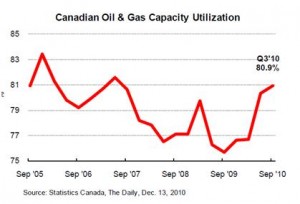
The percentage of industrial capacity being used in Canada’s oil and gas drilling sector rose to 80.9% in the third quarter of 2010, up from 80.3% in the second quarter. The increase brings national utilization to its highest point since the spring of 2007—long before the crash in energy prices sent Alberta’s energy dependent economy spiralling into recession. 

Total capacity utilization for all sectors in the country rose to 78.1% in the third quarter, up from 76.9% in the second quarter. It was the fifth consecutive increase since the record low rate of 67.8% in the second quarter of 2009. 

Capacity utilization is a useful indicator that estimates how much machinery, equipment, and other production resources are being activity put to use. The higher the utilization rate, the smaller is the excess capacity. As utilization rates approach 100%, inflationary pressures start to build. 

Utilization rates are not calculated at the provincial level, but the oil and gas sector in Canada is dominated by activity in Alberta. 

At 80.9% capacity utilization, the energy sector is clearly in better shape than it was a year or two ago. Higher oil prices have been the main driver, and utilization rates are building. However, weak natural gas prices are still leaving plenty of spare capacity on that side of the industry.

Red Deer Market Update – Dec. 10/10

Friday, December 10th, 2010
Market Update to Dec. 9/10 Red Deer
Price Range All

Active

Pending Active 1 Year Ago Sold MTD

Nov. 30/10

Sold MTD

Dec. 9/10

Sold MTD

Dec. 9/09

< 100 24 1 20 4 4 2
100 – 150 37 3 26 2 1 1
150 – 200 58 2 39 6 5 2
200 – 250 73 7 66 22 7 5
250 – 300 114 5 94 28 9 3
300 – 325 44 3 38 15 5 4
325 – 350 41 2 42 7 0 3
350 – 375 28 1 24 6 3 3
375 – 400 36 1 29 3 1 5
400 – 450 40 4 35 8 0 1
450 – 500 31 1 19 4 1 1
500+ 53 1 52 8 1 1
Total 579 31 484 113 37 31
Avg. Price $321,356. $329,239. $309,608. $273,516. $296,084.
Days On Market 65 56 58 58 53

The Average House Price is Up?

The Red Deer Advocate, CMHC, The Bank of Montreal and the Realtor’s Association of Central Alberta have all recently reported that average sale prices are up this year.  Many folks who have been trying to sell their homes may be scratching their heads wondering why “reputable” sources would say something like that when their real estate associates are telling them that prices are down.  It’s a shame some of the experts don’t explain their statistics a little better.

There is a simple explanation.  In April of 2010, the rules for mortgage qualifying got a lot tougher.  The Federal Government instructed CMHC (and therefore the banks) to make it harder to qualify for a mortgage to prevent Canadians from getting into a mess like the Americans are trying to clean up now.

Those rule changes most affected first time buyers and sales of “starter homes” (sale prices less than $300,000) dropped 25% in the first 11 months of 2010 compared to the first 11 months of 2009.  In the same period sales of move up and high end homes also dropped, but only by 14%.

Surprise!  Sales of homes over $500,000 during that same time frame increased by more than 30%!

So, if more high priced homes sold compared to low priced homes in 2010 compared to 2009, it only makes sense that the ”average” price is higher.

You really can make statistics say anything you want.

The real truth about house prices can only be found through direct comparison of similar homes sold during the different time frames.  That process is not an exact science either, but it is likely more accurate than using mere averages.

An analysis of sales of starter and move up homes in Red Deer suggests that house prices in Red Deer are down between $10,000 and $20,000 (depending on the price range) from last spring before the government changed the rules and this fall.

The rule changes probably had a large influence on prices since activity in the housing market starts at the bottom of the price range and works its way up.  When lower priced homes sell for less, those people have to move up to a lower price, especially when it’s harder to qualify for a mortgage.

Obviously the economy is another factor affecting house prices.  While we are seeing signs that things are looking up, it may be a while before there is enough improvement to affect house prices.  It took 8 months for prices to come down 3 to 4 percent and it will almost certainly take that long for them to recover that much.

This is the new normal.  Make your home buying and selling decisions based on your family’s needs, not on your expectations for price inflation.  It’s always a good time to buy or sell if it’s in your family’s best interests.

Red Deer Weekly Market Update – Dec. 3/10

Friday, December 3rd, 2010
Market Update to Dec. 2/10 Red Deer
Price Range All

Active

Pending Active 1 Year Ago Sold MTD

Nov. 25/10

Sold MTD

Nov. 30/10

Sold MTD

Nov. 30/09

< 100 25 1 21 4 4 4
100 – 150 37 1 28 2 2 1
150 – 200 54 1 43 6 6 11
200 – 250 79 9 72 17 22 21
250 – 300 117 6 104 21 28 20
300 – 325 49 4 41 14 15 19
325 – 350 41 0 44 7 7 13
350 – 375 28 1 28 6 6 9
375 – 400 39 2 36 3 3 5
400 – 450 39 1 38 8 8 4
450 – 500 33 1 22 4 4 2
500+ 54 2 61 8 8 5
Total 595 29 538 100 113 114
Avg. Price $322,950. $334,856. $312,922. $309,608. $291,957.
Days On Market 64 53 57 58 47

The New Normal – Let’s face it.  We could sit around and lament about the good old days – when house prices were going up $10,000 per month – but were they really the good old days?  When you had to compete with 3 or 4 or more other buyers and offer more than full price for a house you didn’t even like that much.  The sooner we stop pining for the good old days and understand that this is the new normal, the better off we will be.  Now is the right time to make a move.

Alberta — Among the most affordable in Canada – RBC Economics Housing Affordability Survey

Despite substantially improved housing affordability in the province since early 2008, housing demand in Alberta is still a shadow of its former self from just a few years ago, and there are few signs that it is picking up meaningfully.

Market conditions remained quite weak in the third quarter, and buyers have emerged clearly in the driver’s seat, causing home prices to decline (down between 0.6% and 2.2% depending on the housing type) and contributing to further improvement affordability. The RBC Measures eased between 0.8 and 1.8 percentage points, more than reversing modest rises in the second quarter. Homeownership in Alberta is among the more affordable in Canada both in absolute terms and relative to its historical averages.

Such a high degree of affordability augurs well for a strengthening in housing demand, once the provincial job market sustains more substantial gains.

Alberta Job Market Lagging… for Now – Todd Hirsch, Senior Economist, ATB Financial

Alberta is used to being #1 when it comes to the economy. Over the years leading up to the 2009 recession, the province was racking up a series of top honours.  But coming out of the recession, Alberta still holds one not-so-flattering #1 position: the most lagging job market.

While some jobs have started to return to Alberta in 2010, employment growth has been slower than in the rest of the country. For Canada overall, total employment has now exceeded its pre-recession peak. Even Ontario has done better in the jobs category coming out of the recession.

During the recession, Alberta’s unemployment rate more than doubled, peaking at 7.5% in March of 2010 (seasonally adjusted). From the peak of employment in fall 2008 to the bottom in March 2010, over 75,000 jobs vanished in Alberta—on a proportional basis, it was the worst hit of all ten provinces.

As always, some perspective is necessary. Even though Alberta’s unemployment rate rose proportionately more than any other province, it started from an extremely low base.

Now, with an unemployment rate of 6% in October, Alberta still has a lower rate than most other provinces—and nearly 2 percentage points below the national average. Not bad, really, for the hardest-hit job market in the country!

However, with Alberta’s economy on the mend, it might not be too long before Alberta sees a return to labour shortages.

Red Deer Weekly Market Update – Nov. 25/10

Friday, November 26th, 2010
Market Update to Nov. 25/10 Red Deer
Price Range All

Active

Pending Active 1 Year Ago Sold MTD

Nov. 18/10

Sold MTD

Nov. 25/10

Sold MTD

Nov. 25/09

< 100 28 4 21 4 5 4
100 – 150 36 0 26 2 2 1
150 – 200 60 0 43 5 6 10
200 – 250 85 6 72 14 17 16
250 – 300 123 10 101 12 21 17
300 – 325 47 3 38 13 14 17
325 – 350 46 0 43 6 7 11
350 – 375 28 0 26 4 6 8
375 – 400 41 0 33 2 3 5
400 – 450 35 1 35 4 8 4
450 – 500 32 1 24 4 4 2
500+ 58 2 60 7 8 3
Total 619 27 522 77 101 98
Avg. Price $320,487. $335,528. $313,167. $312,922. $290,155.
Days On Market 66 52 55 57 49

Market Update –  CMHC held their Annual Housing Market Update in Calgary this past week.  The information provided was very comprehensive and well presented and offered an economic perspective for Canada, Alberta and most of the larger cities in Alberta.

Good news!  Canada is on sound economic footing.  The average Canadian has equity in their homes and have not over-indulged on credit they can’t afford.

Most of the jobs lost in the recession have been recovered and we are on the way to economic recovery, how quickly will be determined by how well the United States and some European countries get through the next year or two.

There are many positive things happening in Alberta and even closer to home in central Alberta.  Oil and natural gas land lease sales are up.  Drilling activity in Alberta is up.  Exports from Alberta are up.  Job growth has re-appeared after being lost for 2 years.  And more people are moving into Alberta than out.

Oilsands projects that have been on the shelf are now being dusted off which will put thousands of people to work and create economic activity and royalty revenues to benefit the whole province.

So, how will all this impact you and the housing market?  Well, it’s all going to take some time.  Prices are not going to magically go up to the levels we experienced in 2007 any time soon.  There is still an abundance of homes available for sale and buyers are not going to be quick to jump into the market until they are very sure that things are getting better.

So, we continue to expect gradual improvement in the market for sellers.  Of course, improvement for sellers means less advantage for buyers.  Those who have been waiting for prices to go down might want to consider some of the signs.  Gradual improvement will mean less choices, higher prices and maybe even higher interest rates.  Things that make homes cost more.

For those who are waiting to sell until their homes increase in value, you might be getting closer, but it’s going to be a while before things are like the good old days, and while you are waiting, remember that the house you want to buy will go up an equal amount.

Truth is, there’s no gain in waiting to sell if you are going to turn around and buy back into this market.  In fact, it might be better to sell and buy now while interest rates are at historical lows and you still have lots of buying choices.

Red Deer Weekly Market Update Nov. 19/10

Friday, November 19th, 2010
Market Update to Nov. 18/10 Red Deer
Price Range All

Active

Pending Active 1 Year Ago Sold MTD

Nov. 11/10

Sold MTD

Nov. 18/10

Sold MTD

Nov. 18/09

< 100 29 1 21 2 4 0
100 – 150 34 0 26 2 2 1
150 – 200 60 1 43 3 5 8
200 – 250 84 6 72 10 14 17
250 – 300 132 12 101 8 12 9
300 – 325 50 1 38 11 13 7
325 – 350 45 1 43 4 6 7
350 – 375 31 1 26 2 4 2
375 – 400 41 1 33 2 2 6
400 – 450 41 4 35 3 4 6
450 – 500 33 0 24 2 4 0
500+ 62 2 60 4 7 3
Total 642 30 522 53 77 66
Avg. Price $323,939. $335,528. $302,903. $313,167. $297,740.
Days On Market 63 52 51 55 47


Market Update
– “Gradual improvement” is often used these days to describe the Alberta economy.  The world economic situation is still described as tenuous but Canada continues to be the bright spot, although we are still very dependent on the rest of the world, especially the U.S., for economic prosperity.  Alberta has typically led Canada out of the doldrums.

 While no one can accurately predict the future, there are some fundamentals that we watch to get a sense of where our real estate market is going.  Real estate prices are driven by the number of properties available in relation to the number of buyers actively looking.  When there are more sellers than buyers, prices will moderate.  When there are more buyers than sellers, competition will drive prices up.

 Job creation causes population growth.  Population growth creates buyers for homes.  It’s really that simple.  We can’t easily track population growth, but we can watch for signs of job creation.  In Alberta the quickest way to create jobs is to see improvement in energy demand and therefore, energy prices.

 The “supply” of homes for sale is gradually shrinking and we are seeing signs of job creation (demand).  If that trend continues, home prices will stabilize.  We are not predicting much in the way of price increases because the next step in the process is a “balanced market” where supply and demand are in balance.  Substantial price inflation requires a move to more buyers than sellers and we don’t see that happening anytime soon.

 There is some risk in waiting to buy if you are hoping for prices to go down.  The other factor for home buyers to consider is interest rates.  Economic growth will almost certainly cause rates to go up, and an increase in interest rates is exactly the same as a price increase for anyone who needs a mortgage to buy their home.

 Energy sector seeing gradual improvement – By Dan Sumner, Economist – Alberta Treasury Branch

 It has been a long tough period for many companies involved in Alberta’s energy sector, but according to the Canadian Association of Oilwell Drilling Contractors (CAODC) activity in Alberta’s most important sector is projected to continue to gradually improve this year and next.

 The CAODC forecasts that there will be an average of 400 active drilling rigs in Western Canada over 2011, and the utilization rate will average a respectable 45%. That compares with an average of 327 rigs projected for 2010 and an average utilization rate of 41%. Moving into the typically busy fourth quarter, activity is projected to rise from current levels, with the utilization rate forecast at 50% over the last three months of 2010.

 The CAODC also noted in its forecast press release that the focus of activity has significantly shifted towards oil, at the expense of natural gas. This shift is expected to continue in 2011 and will spell good news for some areas of Alberta and not so good news for others.

 Although the CAODC does not make specific forecasts for Alberta, with much of Western Canada’s oil exploration occurring here, drilling activity should follow this general up trend.  The gradual recovery in conventional energy exploration will definitely be very good news for Wild Rose Country, as the industry is the fundamental driver of so many other sectors in the province.

 Although activity is far from the boom days of the mid-decade, the current pace of activity is enough to support gradual, sustainable economic growth. It is very fortunate that many energy producers are able to shift their focus towards oil, with natural gas prices so weak, because if this was not the case, the current economic landscape in Alberta would be a lot shakier.

Red Deer Weekly Market Update – Nov. 12/10

Friday, November 12th, 2010

Market Update to Nov. 12/10 – Red Deer


Active Listings

Sales

Price Range

Active Today

Pending

Sold MTD

Nov. 5/10

Sold MTD

Nov. 12/10

Sold MTD

Nov. 12/09

0-100

29

1

0

2

2

100-150

35

0

1

2

0

150-200

58

1

0

4

2

200-225

34

4

2

6

6

225-250

49

5

4

4

4

250-275

62

1

1

5

5

275-300

71

4

1

3

6

300-350

100

1

4

13

13

350-400

71

5

1

4

7

400-450

39

4

0

3

1

450-500

32

2

0

2

1

500+

62

3

0

4

1

Total

642

31

14

52

48

Avg. Price

$324,437

$265,492

$302,959

$291,835

Avg. Days on Market

60

55

51

45

Red Deer Weekly Market Update – Nov. 5/10

Friday, November 5th, 2010

Market Update to Nov. 5/10 – Red Deer


Active Listings

Sales

Price Range

Active Today

Pending

Sold MTD

Oct. 31/10

Sold MTD

Nov. 5/10

Sold MTD

Nov. 5/09

0-100

30

1

1

0

2

100-150

38

0

0

1

0

150-200

57

1

5

0

1

200-225

39

5

5

2

4

225-250

51

1

6

4

4

250-275

54

2

10

1

2

275-300

69

4

13

1

4

300-350

90

12

14

4

3

350-400

76

2

13

1

3

400-450

44

2

5

0

0

450-500

33

3

1

0

1

500+

60

6

3

0

0

Total

641

39

76

14

24

Avg. Price

$322,853

$304,618

$265,492

$264,179

Avg. Days on Market

60

49

55

46

Red Deer Weekly Market Update – Oct. 15/10

Friday, October 15th, 2010

Market Update to Oct. 14/10 Red Deer

Price Range

All

Active

Pending

Active 1 Year Ago

Sold MTD

Oct. 7/10

Sold MTD

Oct. 14/10

Sold MTD

Oct. 14/09

< 100

29

0

22

1

1

0

100 – 150

43

0

27

0

0

1

150 – 200

64

2

56

0

1

8

200 – 250

100

5

93

2

6

17

250 – 300

137

7

104

1

12

9

300 – 325

55

1

46

2

4

7

325 – 350

60

2

53

2

3

7

350 – 375

41

0

29

4

4

2

375 – 400

45

1

39

3

3

6

400 – 450

47

0

38

1

2

6

450 – 500

41

2

30

0

1

0

500+

69

1

61

0

1

3

Total

731

21

598

16

38

66

Avg. Price

$327,140.

$331,032.

$290,318.

$304,536.

$297,740.

Days On Market

61

49

56

56

47

Good News for Alberta Housing Markets – Last week we heard that oil and gas lease sales in Alberta have hit an all time record in 2010 with 5 more land auctions still to come.  That means that oil and gas exploration will follow, maybe not this year, but soon.  It also means an inflow of cash into our provincial government coffers.


New oil and gas exploration means new jobs.  New jobs mean population growth.  Population growth means demand for houses.


Demand for houses means economic growth and prosperity since the construction industry is one of the engines that drives our economy.


Our housing markets in central Alberta have just experienced a slow summer, which was to be expected since the local economy has been slow and we have not experienced much job creation or population growth in the past year.


Recent news indicates that net in-migration to Alberta from other provinces increased substantially in the second quarter of 2010 after negative growth in the three previous quarters.  The numbers are not nearly what they were in the boom years, but are a huge improvement.


Alberta has always led the rest of the country out of a slow time.  The demand for our exports in the US is still not what it could be, but recent news suggests they are looking at our oil sands as a safe source of energy.  Economic growth in south-east Asia and China is still relatively strong and there will be new demand for our commodities from there.


We own the second largest proven reserves of oil in the world.   We know that even in a slow economy the world is consuming vast amounts of oil and gas and eventually the demand will outstrip existing reserves.  Ft. McMurray and the oil sands seem a long way removed from central Alberta, but things are booming up there as companies rush to develop more production capacity.


While low natural gas prices have held back much of our energy industry, there are some who are predicting higher prices next year.  That theory would be supported by the sale of those leases previously mentioned.  As an added bonus, a small increase in natural gas prices will have an immediate effect on government revenues which eventually flow into our economy.


Alberta is the land of milk and honey.  We have the lowest taxes, the least amount of debt, the largest oil reserves and the most opportunity!  It is the best place in the world to live and work and I am thankful to be here.

Red Deer Weekly Market Update – Oct.8/10

Friday, October 8th, 2010

Market Update to Oct. 7/10 Red Deer

Price Range

All

Active

Pending

Active 1 Year Ago

Sold MTD

Sept. 30/10

Sold MTD

Oct. 7/10

Sold MTD

Oct. 7/09

< 100

28

0

22

2

1

0

100 – 150

40

0

27

5

0

0

150 – 200

62

2

60

7

0

3

200 – 250

101

4

100

15

2

8

250 – 300

137

11

88

23

1

4

300 – 325

50

0

41

11

2

3

325 – 350

63

2

51

10

2

5

350 – 375

43

4

33

8

4

0

375 – 400

48

2

40

3

3

1

400 – 450

49

2

42

5

1

3

450 – 500

38

1

28

1

0

0

500+

73

2

66

5

0

1

Total

732

30

598

95

16

28

Avg. Price

$330,374.

$334,456.

$294,270.

$290,318.

$291,285.

Days On Market

59

49

55

56

48

Oilpatch rebounds to record – by Harley Richards – Red Deer Advocate – The word “record” hasn’t been used in connection with Alberta’s oilpatch for some time. But the provincial government was able to dust off the word and insert it into a recent news release reporting on the status of this year’s oil and gas land sales.


As of last Wednesday, it had collected $1.86 billion in revenues from lease and licence sales — surpassing the previous high of $1.83 billion earned in 2005. And with five more sales scheduled before year end, the tally will grow.

“That’s a great sign,” said Brad Rowbotham, general manager of Red Deer’s Roll’n Oilfield Industries Ltd.   “It gives all of us reason to have some optimism that a lot of people could be going back to work.”


Don Herring, president of the Canadian Association of Oilwell Drilling Contractors, said his organization noted improved land sales early this year but hadn’t anticipated that they would be this high after just nine months.   “I think it took us by surprise that they were as good as they are.”


Herring said drilling activity in the third quarter of 2010 — with an average active rig count of 322 — is up more than 80 per cent from the same period last year. The increase would have been greater, he said, if rigs hadn’t been bogged down in wet weather.


“As we go into the fourth quarter, our forecast is calling for a significant increase again over what we saw last year,” he said, predicting an average active rig count of about 400.


“I would think in 2011 we’ll see additional activity, beyond what we’re seeing now, but we haven’t got there yet.”   CAODC members are much more optimistic than they were a year ago, said Herring.   “Their frame of mind is much improved.”


Rick Doré, Nabors Production Services district manager for Sylvan Lake, is among those with a more bullish outlook.  “This year, from probably late spring to early summer, has definitely picked up and been busier than last year.  “As long as oil prices stay where they’re at and gas prices creep up a little bit, I think it’s pretty positive.”


Rowbotham has also observed increased activity and is hopeful more money will be invested in production in 2011.   “You’ve got to figure with those land sales that there are going to be a group of customers who are going to have better budgets next year than this year.”


He thinks the big reason for the improved health of the energy sector is the price of oil. Herring believes production incentives and a more favourable royalty structure announced by the province this spring were also factors.  “Had we not seen those changes, in spite of the fact we have high commodity prices, we wouldn’t see so much activity in Alberta.”


Although much of the drilling fleet remains inactive, many of those rigs were designed for natural gas production, particularly in shallow fields, said Herring.


“The part of the fleet that’s running almost at capacity is that that’s directed at oil and some of these natural gas plays that have horizontal drilling with multi-stage fracs.”


Whereas natural gas accounted for about two thirds of the wells drilled in Canada a few years ago, the low-priced commodity now makes up about 40 per cent of the total, noted Herring.


Rowbotham thinks a spike in natural gas prices several years ago probably attracted more capital to this energy source than Western Canada’s geology warranted.   “They forgot that it’s called the oilpatch for a reason — not the gaspatch.”


He added that the limiting factor if the energy sector continues to prosper will not be drilling and service rigs, but the people to operate them.   “A lot of companies in the industry are really going to have a tough time,” he said, pointing to the loss of manpower during the recent downturn and the considerable training required to prepare new people for the field.

Red Deer Weekly Market Update – October 1/10

Friday, October 1st, 2010

Market Update to Sept. 30/10 Red Deer

Price Range

All

Active

Pending

Active 1 Year Ago

Sold MTD

Sept. 23/10

Sold MTD

Sept. 30/10

Sold MTD

Sept. 30/09

< 100

28

1

23

2

2

4

100 – 150

41

0

24

5

5

3

150 – 200

67

0

54

7

9

6

200 – 250

105

3

106

15

18

25

250 – 300

141

7

81

23

29

24

300 – 325

52

1

40

11

16

14

325 – 350

62

1

43

10

13

13

350 – 375

44

4

33

8

8

8

375 – 400

53

3

38

3

3

6

400 – 450

48

1

44

5

10

14

450 – 500

35

1

26

1

1

3

500+

76

1

66

5

7

2

Total

752

23

578

95

121

122

Avg. Price

$330,639.

$335,691.

$294,270.

$300,488.

$297,656.

Days On Market

61

47

55

57

43

Market Update – We have stated in the past that new home construction is only necessary if we have population growth to fill those new homes.  A healthy residential construction industry is one of the engines that drives an economy.


The negative growth trend of the past 3 quarters was abruptly reversed in the second quarter of this year and while those numbers don’t suggest a return to the heyday, they are very encouraging and may signal the beginning of better times in Alberta.


The effect of this recent growth will most likely be felt in the rental vacancy rates, but when vacancy rates go down, people start to look at moving from rental to ownership and the housing cycle begins.


Of course, this growth must continue in order to see long term benefit and that requires jobs.  Jobs bring people to Alberta and the biggest job generator in Alberta has always been the energy industry.  We suspect that the oil sands are the largest contributor to the recent growth which will not have an immediate impact on central Alberta.  But, energy activity anywhere in Alberta contributes to the overall economic health of the whole province


Migrants Reverse CourseDan SumnerEconomist, ATB Financial


One of the best measures of the relative economic and social health of a region is whether migrants are moving to or from the region. According to Statistics Canada data released this morning, Alberta just experienced its most solid quarter of interprovincial migration in a year.


2,820 Canadians moved to Alberta from other provinces during the second quarter of 2010, up from only 312 in the first quarter and net-negative migration in the two quarters before that (see graph). In addition to the positive reading on interprovincial migration, Alberta’s total population grew at the fastest rate in Canada, rising by 0.5% to 3.72 million.


The main factor driving Canadians to move between provinces is jobs and job prospects. During the mid-decade unsustainably strong job prospects drove migrants to Alberta from all corners the country, although this trend reversed course quickly during the recession.


Statistics Canada also noted that behind Alberta’s lofty population growth rate was a strong level of natural increase (births minus deaths). This is partly due to demographics as Alberta’s population also has the lowest median age at 35.8 (national average = 39.7), and more young people means more babies.


The strongest reading on interprovincial migration since the recession began is good news for a province that isn’t used to losing residents to other provinces on a net basis. However, considering the jobs market here is unlikely to return to its pre-recession pace for some time, Canadians are unlikely to flock to Alberta at the rates they did during the boom.